Introduction to NetLogo
Note: This lesson is in alpha status! It may have issues that have not been addressed.
Lesson Objectives
- Using the NetLogo user interface (UI) to run models
- Modifying model parameters with the UI to run experiments
- Simple commands
- Procedures to alter and extend existing models
The NetLogo environment
Start the NetLogo application to begin a basic tour.
The window you see is called the NetLogo integrated development environment (IDE). It has seveal parts:
| IDE Component | Description |
|---|---|
| Interface | Control, run, and visualize model (current tab) |
| Info | Description of model purpose, function, and features (middle tab) |
| Code | Model syntax (last tab) |
| View | Monitor, i.e. the ‘World’, used for real-time model visualization |
Model Library
The NetLogo model library has many examples to explore.
- Choose “Models Library” from the File menu.
- Open the “Biology” folder.
- Click on the model called “Wolf Sheep Predation”.
- Press the “open” button.
The Interface tab will fill up with lots of buttons, switches, sliders and monitors. These interface elements allow you to interact with the model. Buttons are blue; they set up, start, and stop the model. Sliders and switches are green; they alter model settings. Monitors and plots are beige; they display data.
The ‘+ Add’ button along the top toolbar allows one to add additional features to the interface.
When you first open the model, the Monitor is empty. To initialize the model with its default setting, press the ‘setup’ button.
There are two different types of buttons: ‘once’ and ‘forever’.
Buttons without arrows, like the ‘setup’ button, perform a task once and then pop back up when the task is completed.
Buttons with arrows, like the ‘go’ button, will run until the user manually stops the task by clicking the same button again.
Many models also have a once button called “go once” or “step once” which is like “go” except that it advances the model by one tick (time step) instead of over and over. Using a once button like this lets you watch the progress of the model more closely.
You can also stop a model with the ‘Halt’ item on the Tools menu, but you should only do this if the model is stuck for some reason. Using ‘Halt’ may interrupt the model in the middle of an action, which could create an error.
The ‘Info’ tab
On this screen, you will find useful ‘meta’ information about the model.
| Section | Description |
|---|---|
| What is it? | Model purpose and topic. |
| How it works | An overview of the functioning of the model, core behaviors, and model features. |
| How to use it | Describes the buttons, sliders, and parameters. |
| Things to notice | What you see in plots and display when running model, as well as questions the model can answer. |
| Things to try | Experiments you can try. |
| Extend the model | Future enhancements or interesting modifications. |
There may also be additional sections, such as: NetLogo Features, Related Models, Credits, and How to Cite.
The ‘Code’ tab
- Extensions
- Global variables
- Attributes of agents (turtles), patches (environment agents)
- Button procedures
- Other procedures
Defining Agents and the Environment in NetLogo:
- Agents are called turtles (can be mobile)
- The environment consists of patches (not mobile)
Speed Slider
The speed slider allows you to control the speed of a model, that is, the speed at which turtles move, patches change color, and so on.
When you move the slider to the left the model slows down so there are longer pauses between each tick (time step). That makes it easier to see what is happening. You might even slow the model down so far as to see exactly what a single turtle is doing.
When you move the speed slider to the right the model speeds up. NetLogo will start skipping frames, that is, it won’t update the view at the end of every tick, only some ticks. Updating takes time, so fewer view updates means the model progresses faster.
Note that if you push the speed slider well to the right, the view may update so infrequently that the model appears to have slowed down. It hasn’t, as you can see by watching the tick counter race ahead. Only the frequency of view updates has lessened.
Let’s see it in action. If you haven’t done so already, press the “setup” button to initialize the model with current settings. Now press “go”.
What model dynamics do you see? How many ‘ticks’ did it take?
Exercise 1
Change to the ‘Info’ tab to learn what each of the sliders and switches represent. Think about what could be changed to get a stable outcome.
Note that in order to re-run the model with new settings, you must click the ‘setup’ button first before hitting ‘go’ again.
Post your green sticky note when you have get both sheep and wolf populations to persist.
Gathering Information: Plots and Monitors
Plots
The plot in Wolf Sheep Predation contains three lines: sheep, wolves, and grass / 4. (The grass count is divided by four so it doesn’t make the plot too tall.) The lines show what’s happening in the model over time. The plot legend shows what each line indicates. In this case, it’s the population counts.
When a plot gets close to becoming filled up, the horizontal axis is compressed and all of the data from before gets squeezed into a smaller space. In this way, more room is made for the plot to grow.
If you want to save the data from a plot to view or analyze it in another application, use the “Export Plot” item on the File menu. It saves the plot data in a format that can by read back by spreadsheet and database programs such as Excel. You can also export a plot by right-clicking it and choosing “Export…” from the popup menu.
Monitors
Monitors are another means of displaying information from a model. Monitors in Wolf Sheep Predation model track the total population of sheep, wolves, and grass. (Remember, the amount of grass is divided by four to keep the plot from getting too tall.)
The numbers displayed in the monitors change as the model runs, whereas the plots show you data from the whole course of the model run.
These are particularly useful if you have a quantitative indicator of model dynamics that you would like to track in real time.
Controlling the View
Like any other simulation software, visualization is computationally costly. You can supress model output in the View by toggling the view updates control.
Press ‘go’. Note the speed of simulation.
Uncheck the ‘View Updates’ box. What happened?
Turning off updates and moving the speed slider all the way to the right will greatly improve simulation time if you just want to produce model results to analyze later.
The size of the view is determined by five separate settings: min-pxcor, max-pxcor, min-pycor, max-pycor, and patch size. Let’s take a look at what happens when we change the size of the view in the “Wolf Sheep Predation” model.
There are more model settings than there’s room for in the toolbar. The “Settings…” button lets you get to the rest of the settings. By modifying the max-pxcor or max-pycor settings, you can change the extent of the model view. With all else the same, this also increases the number of patches. Note that the grass monitor changes values when you increase the model extent.
Modify the patch size, however, does not change the number of patches.
More on the Model Library
A tremendous resource for code ideas! The library contains four sections: Sample Models, Curricular Models, Code Examples, and HubNet Activities.
Sample Models
The Sample Models section is organized by subject area and currently contains more than 200 models. We are continuously working on adding new models to it, so come visit this section at a later date to view the new additions to the library. Some of the folders in Sample Models have folders inside them labeled “(unverified)”. These models are complete and functional, but are still in the process of being reviewed for content, accuracy, and quality of code.
Curricular Models
These are models designed to be used in schools in the context of curricula developed by the CCL at Northwestern University. Some of these are models are also listed under Sample Models; others are unique to this section. See the Info tabs of the models for more information on the curricula they go with.
Code Examples
These are simple demonstrations of particular features of NetLogo. They’ll be useful to you later when you’re extending existing models or building new ones. For example, if you wanted to add a histogram to your model, you’d look at “Histogram Example” to find out how.
HubNet Activities
This section contains participatory simulations for use with groups. For more information about HubNet, see the HubNet Guide.
Making a simple model
The Command Center is found in the Interface tab. It allows you to enter commands or directions to a model. Commands are instructions you can give to NetLogo’s agents: turtles, patches, links, and the observer.
Start by creating a new model file:
File > New
Model Objective
We are going ask some patches to turn green, create a set of agents, and have them move around. We will ask the patches to count how many agents are on them.
Commands
Into the Command Center input (at the observer> prompt), type the following:
count patches
observer: 1089
Why do we get that answer?
ask n-of 20 patches [set pcolor green]
count patches with [pcolor = green]
observer: 20
Create some agents
create-turtles 10 [set size 3]
Make them move
ask turtles [rt random 360 fd 10]
What are rt and fd?
If you need help, type a command at the observer> prompt and hit F1.
What did we just tell our agents to do? Here is what each command in the ‘move-turtles’ procedure does:
ask turtles [ ... ]says that each turtle should run the commands in the brackets.rt random 360is another command that uses a reporter.- each turtle picks a random whole number between 0 and 359. (random doesn’t include the number you give it as a possible result.)
- each turtle turns right (or
rtfor short) this number of degrees
fd 10makes the turtle move forward ten steps.
Change agent appearances
ask n-of random 10 turtles [set color red set shape "circle"]
ask n-of 10 turtles [set color red set shape “circle”]
To see shape options:
show shapes
observer: ["default" "airplane" "arrow" "box" "bug" "butterfly" "car" "circle" "circle 2" "cow" "cylinder" "dot" "face happy" "face neutral" "face sad" "fish" "flag" "flower" "house" "leaf" "line" "line half" "pentagon" "person" "plant" "sheep" "square" "square 2" "star" "target" "tree" "triangle" "triangle 2" "truck" "turtle" "wheel" "wolf" "x"]
Maybe something more uplifting …
ask n-of random 10 turtles [set color yellow set shape "face happy"]
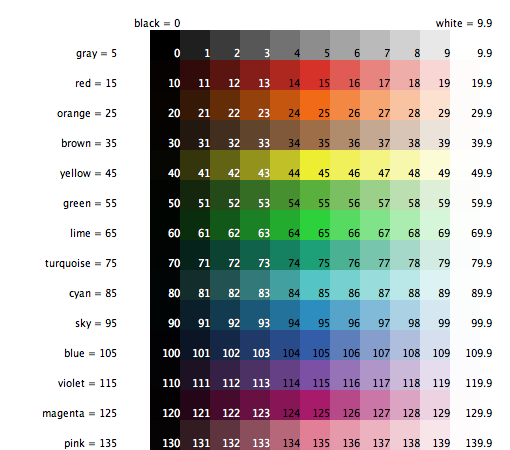
Interlude: Colors in NetLogo
Notice that we used ‘pcolor’ to change the color of patches, and ‘color’ to change the color of turtles. Each of these is an entity-specific attribute.
In NetLogo, colors have a numeric value. In all of the exercises we have been using the name of the color. This is because NetLogo recognizes 16 different color names. This does not mean that NetLogo only recognizes 16 colors. There are many shades in between these colors that can be used too. Here’s a chart that shows the whole NetLogo color space:
And if you don’t have the chart …
You can send commands to specific entities by changing the object of the command line. Choose “turtles” from the popup menu in the Command Center (or use the tab key).
For example, when you type:
set color red
this does the same thing as if you had typed:
set color 15
If you want an intermediate shade, but don’t know the number, adding or subtracting a number from a name will work too.
And you can get a lighter or darker version of the same color by using a number that is a little larger or a little smaller, as follows.
Choose “patches” from the popup menu in the Command Center (or use the tab key).
set pcolor red - 2
(The spacing around the “-“ is important.)
By subtracting from red, you make it darker.
set pcolor red + 2
By adding to red, you make it lighter.
Back to the model
Count your turtles
count turtles
observer> show count turtles
observer: 10
Notice that NetLogo accepts this even though it is shorthand. The full command is printed in the Command Center window. You can recall through past commands with the ‘up’ arrow.
Count by agent attribute:
count turtles with [color = yellow]
0
Make agents move
ask n-of 20 patches [set pcolor green]
ask turtles [move to one-of patches with [pcolor = green]]
Why didn’t this work?
The Netlogo dictionary can help: File > Help
Look at turtle commands that are similar. We just need to add a dash in between “move” and “to”.
ask turtles [move-to one-of patches with [pcolor = green]]
Extracting information
ask patches with [pcolor = green][show count turtles-here]
ask turtles with [color = red][die]
count turtles
clear-all
(patch 13 -2): 1
(patch -13 13): 1
(patch 3 -7): 2
(patch 1 -4): 1
(patch -7 0): 1
(patch 2 -14): 1
(patch 7 -1): 0
(patch 8 4): 0
(patch -3 -11): 0
(patch -15 5): 0
(patch -1 3): 0
(patch 0 -14): 0
(patch -14 -1): 0
(patch -5 -15): 2
(patch 3 -15): 0
(patch 15 -14): 0
(patch -7 8): 0
(patch -7 15): 0
(patch 13 -4): 0
(patch -5 10): 1
observer> show count turtles
observer: 10
More online
Thus far, we have been working with complete sets of entities (e.g., all turtles), but you may want to refer to specific agents or sub-groups.
For instructions on how to access, manipulate, and monitor specific entities, see Tutorial #2 in the NetLogo User Manual.
Spatial neighborhoods
The following commands would be useful for modeling mobility, segregation/aggregation, growth, and foraging
create-turtles 1
ask turtles [ask neighbors [set pcolor green]]
The default neighborhood is a Moore neighborhood of 8 adjacent patches
The alternative Von Neumann neighborhood has 4 neighbors, one in each cardinal directions:
ask turtles [ask neighbors4 [set pcolor yellow]]
Agent movement
ask turtles [move-to one-of neighbors4]
Repeat. See what happens when you remove the “4”.
Move agent and change patch attribute
ask turtles [move-to one-of neighbors ask patch-here [set pcolor red]]
Repeat. See what happens when add to neighbors 4.
How many red patches?
count patches with [pcolor = red]
observer: 1
Acknowledgements & Support
Portions of the instructional materials are adopted from Andrew Crooks, Melanie Swartz, and the NetLogo User Manual.
If you need to catch-up before a section of code will work, just squish it's 🍅 to copy code above it into your clipboard. Then paste into your interpreter's console, run, and you'll be ready to start in on that section. Code copied by both 🍅 and 📋 will also appear below, where you can edit first, and then copy, paste, and run again.
# Nothing here yet!