
March 28, 2021 by Allie Cahanin , Katie Toren
Today’s post here on The CyBlog is a guest post by Allie Cahanin and Katherine Toren, Grand Prize winners of the 2021 UMD Data Challenge.
As graduate students in the Geographical Sciences Department at the University of Maryland, pursuing MS degrees in Geospatial Intelligence (GEOINT), we are always looking for ways to practice and improve our analytical skills on real-world datasets. This February, we participated in the 2021 UMD Data Challenge (DC21) with the goal of improving our skills in data exploration and data science. As newbies to data science, we were excited to have Quentin Read, a data scientist with SESYNC, assigned as our mentor for the week!
The Data Challenge is an annual, week-long data exploration event hosted by The UMD College of Information Studies, where participants gain analytical experience, build technical aptitude, and obtain team-building experience. The goal is for each team to evaluate a dataset, formulate a question about the dataset, and conduct dataset integration, analysis, and results preparation. Government and research institution sponsors provide real-world datasets. We chose the Packaged Meals dataset, provided by U.S. Department of Agriculture (USDA) in support of this year’s theme, “Data Exploration to Cultivate Better Living.”
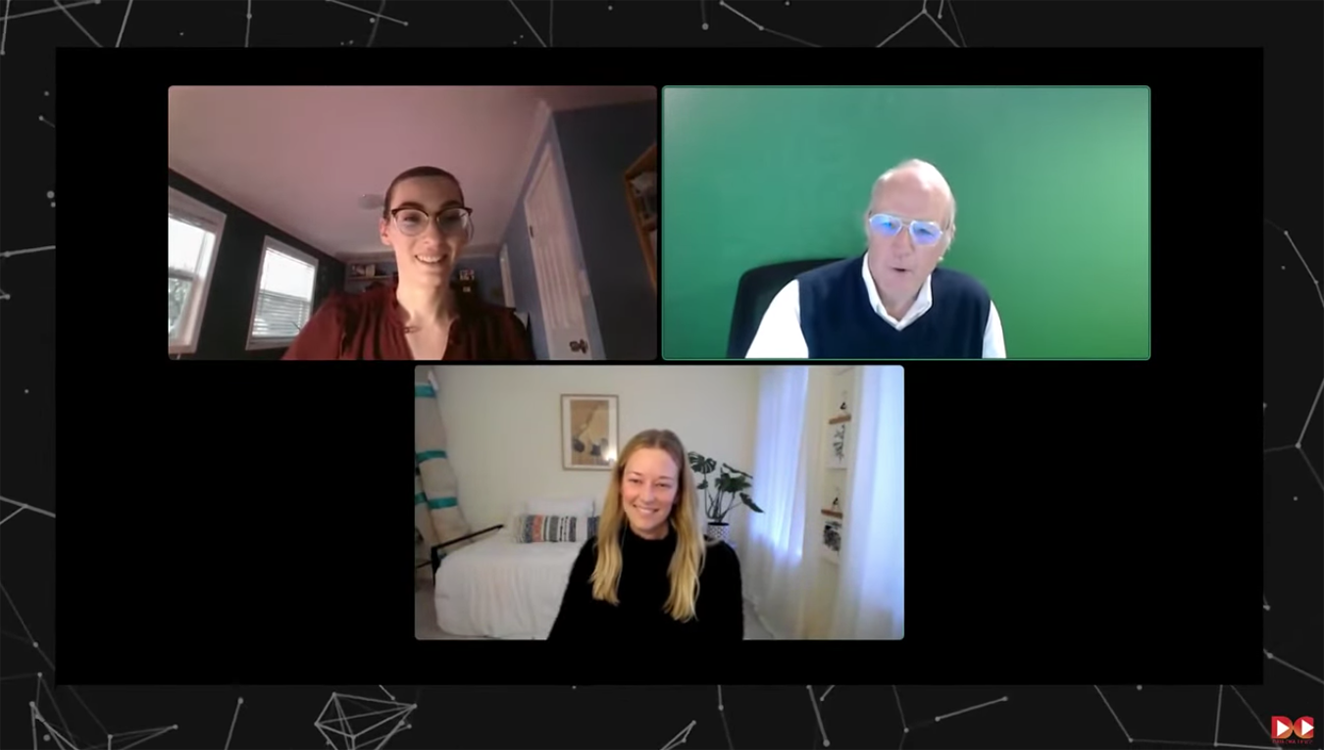
 Allie (top left) and Katherine (bottom) accept the Grand Prize at DC21 from Dean Doug Oard, UMD College of Information Studies.
Americans have grown to rely on the convenience of foods prepared outside of the home. The USDA manages a branded food product database with a goal to enhance public health and openly share data on the nutrient composition of branded foods and private label data provided by the food industry. For DC21, we worked with a subset of data prepared from this database which included categories of information on packaged meals, with the end goal of helping the USDA identify the most popular ingredients and the combinations of those ingredients. We proposed to answer three questions during the challenge:
Although the dataset was fairly clean, the ingredients for each meal were all listed in one cell which also contained brackets, parentheses, special characters and extraneous words that would need to be removed before we could unnest each word token.
Cleaning the dataset proved to be the most time-consuming part of the project, especially since this was our first time using regular expressions in R. In the end we developed a long list of simple regular expressions to remove instances of extraneous words and characters. There are certainly more sophisticated methods, but as newbies to text mining we used this opportunity to get our hands dirty and build foundational data cleaning skills. With tidy data, we were able to unnest, sort, and rank the ingredients from most frequently used to least and created both a CSV and a PDF of these results for use by others.
Tip: See the R CHEAT SHEET: Work with strings with stringr for help with manipulating string data and working with regular expressions!
Our original plan was to perform principal component analysis (PCA) of the ingredients found in packaged meals to reduce dimensionality and evaluate which ingredients contribute to the most variance in the dataset. However, we quickly discovered that it would be difficult to derive any meaning from the distribution of meals since principal components one and two only accounted for a combined 7% of the variance. This led us to download supplemental data from the USDA branded food product database about the nutritional value of each meal for PC analysis. Our biplot visualization revealed that vegetable based meals were set apart from other branded food categories and that high vitamin and mineral values were contributing to a significant part of this variance. This realization allowed us to focus on a few key nutrients and discover that iron is lacking from the majority of packaged meals. If eaten 3 times per day, these meals will not meet the RDA of iron for men or women, which might be contributing to anemia (lack of iron in diet) highlighted as a public health issue in the US by the World Health Organization’s Nutrition Landscape Information System (NLiS).
Based on our work, we made recommendations that the USDA:
When we registered for DC21, we were hoping it would give us an opportunity to learn some new packages and functions in R, but looking back it gave us so much more. We had the opportunity to explore many facets of real world data science including: using tools like GitHub to work as a team remotely and easily version and manage our code, researching the complex background of our topic to inform our recommendations, and even speaking with data scientists at the USDA about the ways in which they’re currently implementing machine learning to analyze these massive branded food and nutrition datasets.
To view our work, check out our GitHub repo from the challenge!
And, finally, for more details on the Data Challenge, or if you’re interested in participating next year — which we highly recommend! — see the iSchool’s data challenge page.