The Landscape of Spatial Data Tools
GIS software is designed to capture, manage, analyze, and display (on a map!) all forms of geographically referenced information. Before diving deep into software, we review basic concepts for geographical data and the associated open source tools.
Geographical Data
Breaking down these uses of GIS, we find the usual components of any data driven project. The strong emphais on geographical marks the special attention that spatial attributes of data require.
| capture | record data with sufficient context to be useful |
| manage | work with vast amounts of data, often captured in different contexts |
| analyze | rely on the inherent spatial relationships between data |
| display | conveniently display data in its native form (on a map!) |
So What?
Why Open Source
- Pros
- Reproducible research principle (no proprietary code)
- Affordable for researchers
- Ease of licensing
- Friendly user community
- Available on multiple platforms (e.g. Windows, Linux, Mac)
- Cons
- Fewer training resources
- Less integration (Pro?)
The excellent and canonical alternative is ESRI’s ArcGIS platform.
Objectives for this lesson
- Discover free geospatial analysis
- Meet the libraries for reading and writing spatial data
- Compare geographic and projected coordinate systems
- Understand distortion in projected data
Specific achievements
- Identify the coordinate system of raster and vector data files
- Crop and resize raster data
- Rasterize vector data
- Transform raster data between projections
- Do all this on the command line
Managing Geographical Data
| Raster | Vector |
|---|---|
| matrix | table |
| surface | shape |
| pixels | features |
| bands | attributes |
Raster File Formats
- GeoTIFF
- netCDF
Some raster formats are generic image formats, and can be opened with a system image viewer or inserted into documents as images.
Vector File Formats
- Shapefiles
- TIGER
- DLG
- WKT
- GeoJSON
Vector formats, even if the information is stored as plain text, need software to lay out the features as an image.
Geospatial Data Abstraction Library (GDAL)
GDAL interprets between a vast collection of storage formats and applications that read or write spatial data. It has a single abstract data model for rasters, and another for vector data. Because GDAL knows all about different formats, it includes many tools for translating and processing geographical data.
gdalinfo --formats
Supported Formats:
  VRT (rw+v): Virtual Raster
  GTiff (rw+vs): GeoTIFF
  NITF (rw+vs): National Imagery Transmission Format
  ...
For historical reasons gdal* commands work with rasters, and ogr* commands work with vectors.
ogrinfo --formats
Supported Formats:
  -> "ESRI Shapefile" (read/write)
  -> "MapInfo File" (read/write)
  -> "UK .NTF" (readonly)
  ...
Looking at Metadata (Rasters)
cd %sandbox%
cd data
gdalinfo natural-earth.tif
Driver: GTiff/GeoTIFF
Files: natural-earth.tif
Size is 8100, 4050
Coordinate System is:
GEOGCS["WGS 84",
  DATUM["WGS_1984",
    SPHEROID["WGS 84",6378137,298.257223563,
      AUTHORITY["EPSG","7030"]],
    AUTHORITY["EPSG","6326"]],
  PRIMEM["Greenwich",0],
  UNIT["degree",0.0174532925199433],
    AUTHORITY["EPSG","4326"]]
Origin = (-180.000000000000000,90.000000000000000)
Pixel Size = (0.044444444444440,-0.044444444444440)
Metadata:
  AREA_OR_POINT=Area
  TIFFTAG_DATETIME=2014:10:18 11:51:41
  TIFFTAG_RESOLUTIONUNIT=2 (pixels/inch)
  TIFFTAG_SOFTWARE=Adobe Photoshop CC 2014 (Macintosh)
  TIFFTAG_XRESOLUTION=72
  TIFFTAG_YRESOLUTION=72
Image Structure Metadata:
  COMPRESSION=LZW
  INTERLEAVE=PIXEL
Corner Coordinates:
Upper Left  (-180.0000000,  90.0000000) (180d 0' 0.00"W, 90d 0' 0.00"N)
Lower Left  (-180.0000000, -90.0000000) (180d 0' 0.00"W, 90d 0' 0.00"S)
Upper Right ( 180.0000000,  90.0000000) (180d 0' 0.00"E, 90d 0' 0.00"N)
Lower Right ( 180.0000000, -90.0000000) (180d 0' 0.00"E, 90d 0' 0.00"S)
Center      (  -0.0000000,   0.0000000) (  0d 0' 0.00"W,  0d 0' 0.00"N)
Band 1 Block=256x256 Type=Byte, ColorInterp=Red
Band 2 Block=256x256 Type=Byte, ColorInterp=Green
Band 3 Block=256x256 Type=Byte, ColorInterp=Blue
Looking at Metadata (Vectors)
ogrinfo -ro -so ne_10m_urban_areas
INFO: Open of `ne_10m_urban_areas'
  using driver `ESRI Shapefile' successful.
1: ne_10m_urban_areas (Polygon)
ogrinfo -ro -so ne_10m_urban_areas ne_10m_urban_areas
INFO: Open of `ne_10m_urban_areas'
using driver `ESRI Shapefile' successful.

Layer name: ne_10m_urban_areas
Geometry: Polygon
Feature Count: 11878
Extent: (-157.991183, -51.053037) - (178.033834, 69.769855)
Layer SRS WKT:
GEOGCS["GCS_WGS_1984",
  DATUM["WGS_1984",
    SPHEROID["WGS_84",6378137.0,298.257223563]],
  PRIMEM["Greenwich",0.0],
  UNIT["Degree",0.017453292519943295]]
scalerank: Integer (10.0)
featurecla: String (50.0)
area_sqkm: Real (13.3)
Translation
In addition to reading spatial data in all those formats, GDAL provides capabilities for writing data in new formats. Translations can also occur between the same format with a step that modifies the data or metadata.
Write metadata about a raster object that is missing from the world.png raster.
gdal_translate -a_srs WGS84 -a_ullr -180 90 180 -90 world.png geoworld.tif
- Question
- Compare the output of
gdalinfofor the originalworld.pngand newgeoworld.tifraster files. What did the “corner coordinates” property of the PNG file correspond to before translation? And after translation?
The spatial data processing tools provided by GDAL are executed by giving “arguments” to the gdal_translate, which take the form -flag param1 param2 ..., which is how most command line utilities work.
The flag -outsize takes two parameters for the horizontal and vertical output size (optionally as percentages of the input size) in pixels.
gdal_translate -outsize 10% 10% geoworld.tif geoworld-small.tif
The flag -projwin takes four parameters that specify the new corners of the output file, giving a subwindow of the input file.
gdal_translate -projwin -180 90 0 0 geoworld.tif geonw.tif
- Exercise
- Choose coordinates that bound your home state or country, and create a new file called
natural-earth-home.tifthat only includes that area of thenatural-earth.tif. The order of parameters is upper left “x”, upper left “y”, lower right “x”, lower right “y”. - Question
- Why bother with this approach over cropping the image with an image editor?
Conversion
Here’s a handy little utility. Ever want to quickly peek at a shapefile? Why not convert it to a raster at the command line?
gdal_rasterize -ot Byte -burn 255 -tr 0.01 0.01 -l ne_10m_urban_areas ne_10m_urban_areas urban-areas.tif
- Exercise
- Examin the metadata of
urban-areas.tifusing the-statsflag. This provides additional information, but does it look right?gdal_rasterizeis very literal, it set polygons to 255 and everything else to 0, whereas areas outside the polygons might be more appropriately set to “Null”. Read the docs to decide how it can be done. Try to re-create the raster so that the mean value is 255.
Geometry Engine Open Source (GEOS)
GEOS works on vectors, also known as geometric objects, and adds advanced GIS functionalities (topological operations) to complement the essential reading, writing and translating utilities in GDAL.
Like GDAL, GEOS is primarily intended to be a library used by other software.
Unlike GDAL, GEOS does not provide its own collection of command line utilities (like gdalinfo).
One piece of software using GEOS is PostgreSQL with the PostGIS extension.
Log back into http://pgstudio.research.sesync.org
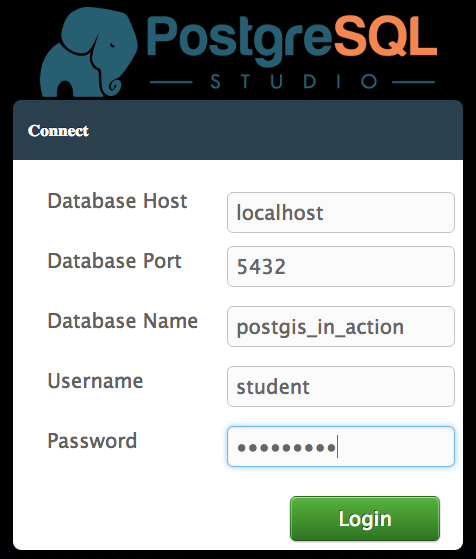
In the SQL window we can execute PostGIS functions that rely on the GEOS libary.
A simple example is the function ST_Length, where ST indicates the function accepts spatial types as arguments.
SELECT ST_Length(ST_GeomFromText('LINESTRING(0 0, 1 1)'));
    st_length
-----------------
1.4142135623731
(1 row)
A very common vector operation in spatial analysis is to create a buffer around a spatial object.
SELECT ST_AsText(ST_Buffer(ST_GeomFromText('POINT(0 0)'), 1, 1));
    st_astext_
----------------
POLYGON((1 0, 0 -1, -1 0, 0 1, 1 0))
- Exercise
- Calculate an approximation to Pi, the ratio of a circle’s circumference to its diamter, using GEOS functionality built into PostGIS. The function
ST_Perimetergives you the length of the perimiter of a polygon.
Naturally, this is all more interesting with actual data.
SELECT id, ST_AsText(ST_Transform(restaurants.geom, 4326))
FROM ch01.restaurants
JOIN ch01.highways
ON ST_Intersects(
    ST_Buffer(restaurants.geom, 100), highways.geom)
WHERE feature like '%Toll Road';
 id   |        st_astext
------+-------------------------
22310 | POINT(-75.2094 40.6943)
25011 | POINT(-121.499 45.7115)
(2 rows)
- Question
- Has anybody actually got an answer? Thirty simultaneous spatial queries might be a bit much for our toy server.
Geographic Coordinate Systems (GCS)
A geographic coordinate system (GCS) is a reference system that makes it possible to specify locations on the surface of the earth by a latitude and longitude.
- An angular unit of measure
- The angular unit of measure is usually a degree, or one 360th of a circle, and fractional degrees are usually specified as decimals.
- A prime meridian
- The location of 0° longitude, e.g. the Royal Observatory, Greenwich, UK
- A datum
- An apprimation to the shape of the earth’s surface and where (in the GCS being defined) certain fixed positions are located. A spheroid (a flattish sphere) is used to approximate this shape, and the reference positions anchor its surface to known points.
Spheroids and Geoids
-
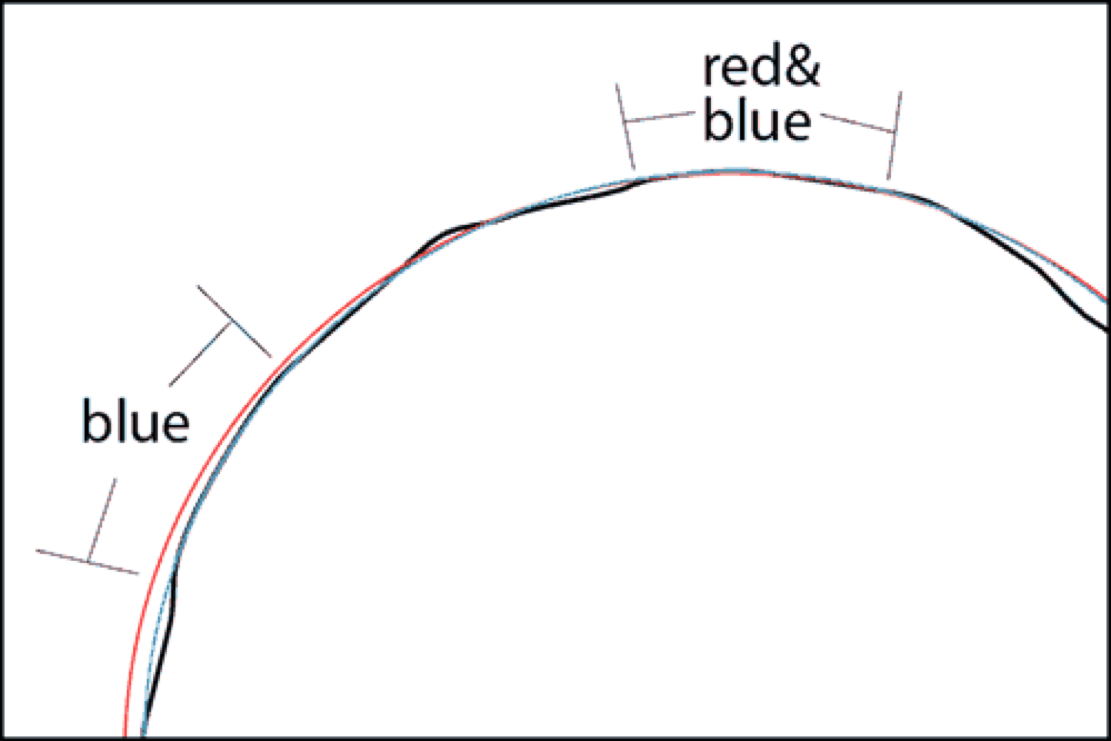
Set an elipse on edge like a coin and spin it: the three dimensional shape you see is a spheroid. This is a simple geometric object.
-
A surface defined by the Earth’s gravity field is called the geoid. The shape of the geoid is irregular, but overall, it approximates mean sea level (or where mean sea level would be without the continents).
-
The geoid is related to a spheroid by it’s height, which can be either positive or negative, on a straight line perpendicular to the spheroid. Note that this height is not the height of the ground, or elevation.
Spheroids and Geoids
Datum
Every geographic coordinate system begins with a precisely surveyed starting point.
- Provides a frame of reference for measuring relative position
- Defines the origin and orientation for lines of latitude and longitude
- Datum transformations
- e.g. ‘WGS84’
- Question:
- Examine the output of gdalinfo for
natural-earth.tifagain (see reminder below). What is the name of Geographic Coordinate System (GEOGCS)? What about the name of the spheroid? Are these different?
gdalinfo natural-earth.tif
Projected Coordinate Systems (PCS)
- A projected coordinate system (PCS) is defined on a flat, two-dimensional surface.
- Unlike a geographic coordinate system, a projected coordinate system has constant lengths, angles, and areas across the two dimensions.
- If you allow height above the flat surface, then you can locate any point in three dimensions with x, y, and z coordinates (these are not coordinates in Space!)
A projected coordinate system is defined by four components:
- a geographic coordinate system
- a map projection
- any parameters needed by the map projection
- a linear unit of measure (such as feet or meters)
- Question
- What GCS is used in
westernfires_vir_2015231_geo.tif? What is the map projection?
Why use a projected coordinate system?
-
Lat/lon is good system for storing spatial data, but areas and distances must be explicitly calculated on a curved surface.
-
You are making a map in which you want to preserve one or more of these properties: area, shape, distance, and direction.
-
You are making a small-scale map such as a national or world map. With a small-scale map, your choice of map projection determines the overall appearance of the map. For example, with some projections, lines of latitude and longitude will appear curved; with others, they will appear straight.
Map Projections
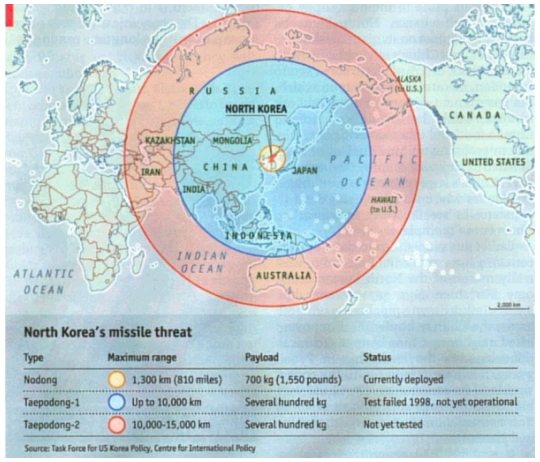
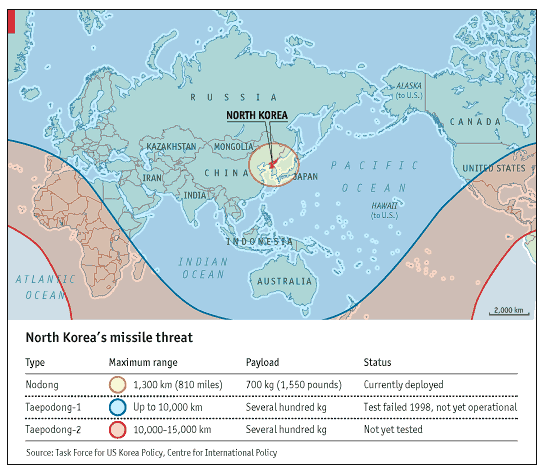
Converts the earth’s three-dimensional surface to a map’s two-dimensional surface. This mathematical transformation is commonly referred to as a map projection.

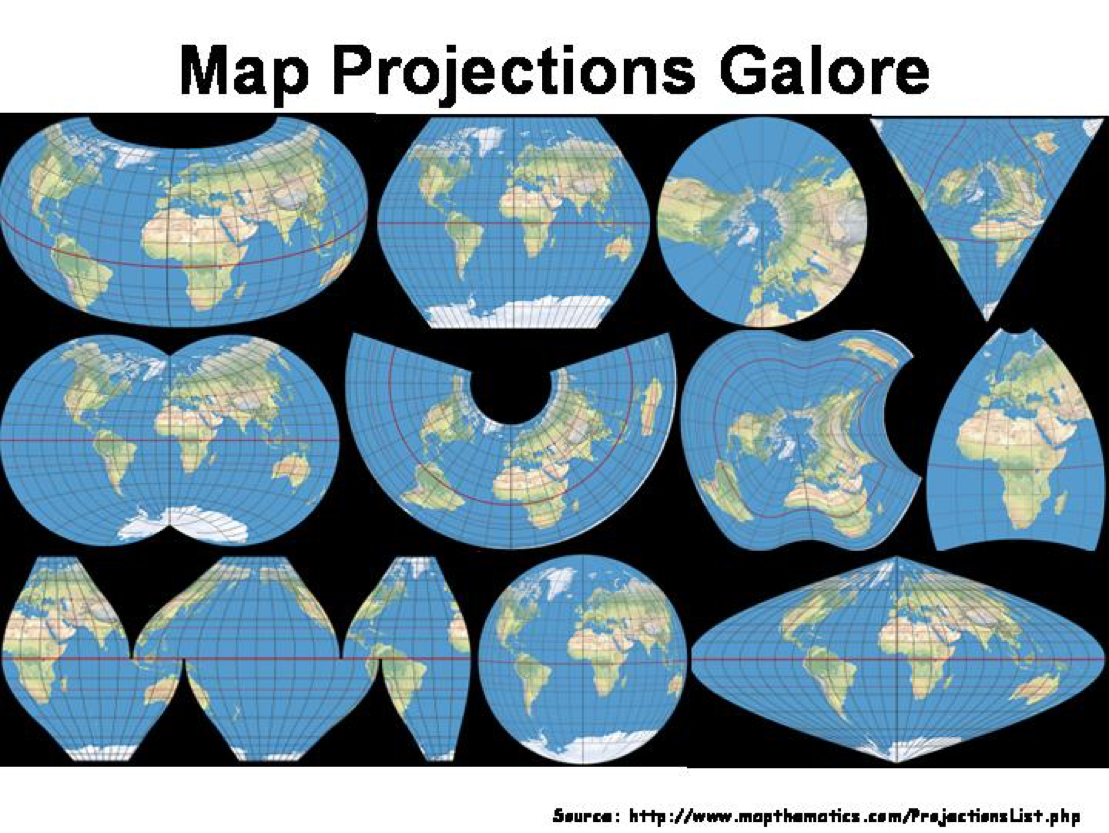
Using GDALs ability to re-project raster images with gdalwarp, let’s compare two rasters.
gdalsrsinfo -o wkt urban-areas.tif > urban-area.prj
gdalwarp -t_srs urban-areas.prj westernfires_vir_2015231_geo.tif westernfires_vir_2015231_geo-prj.tif
gdalinfo westernfires_vir_2015231_geo-prj.tif
gdal_translate -projwin -139.2611826 57.8698551 -80.7311826 22.2398551 urban-areas.tif urban-areas-west.tif
Distortion
Projected coordinate systems – they distort the world.
Four spatial properties subject to distortion in PCS:
- shape
- area
- distance
- direction
The most recognizable distortion is the result of treating latitude and longitude values as if they were the “x” and “y” values of a projected coordinate system.

Choose Projections Wisely!
| Name | Feature that is Preserved |
|---|---|
| Conformal | Shape |
| Equal Area | Area |
| Equidistant | Distance between one or two foci and every other point |
| Azimuthal | Direction from one of two points to every other point |
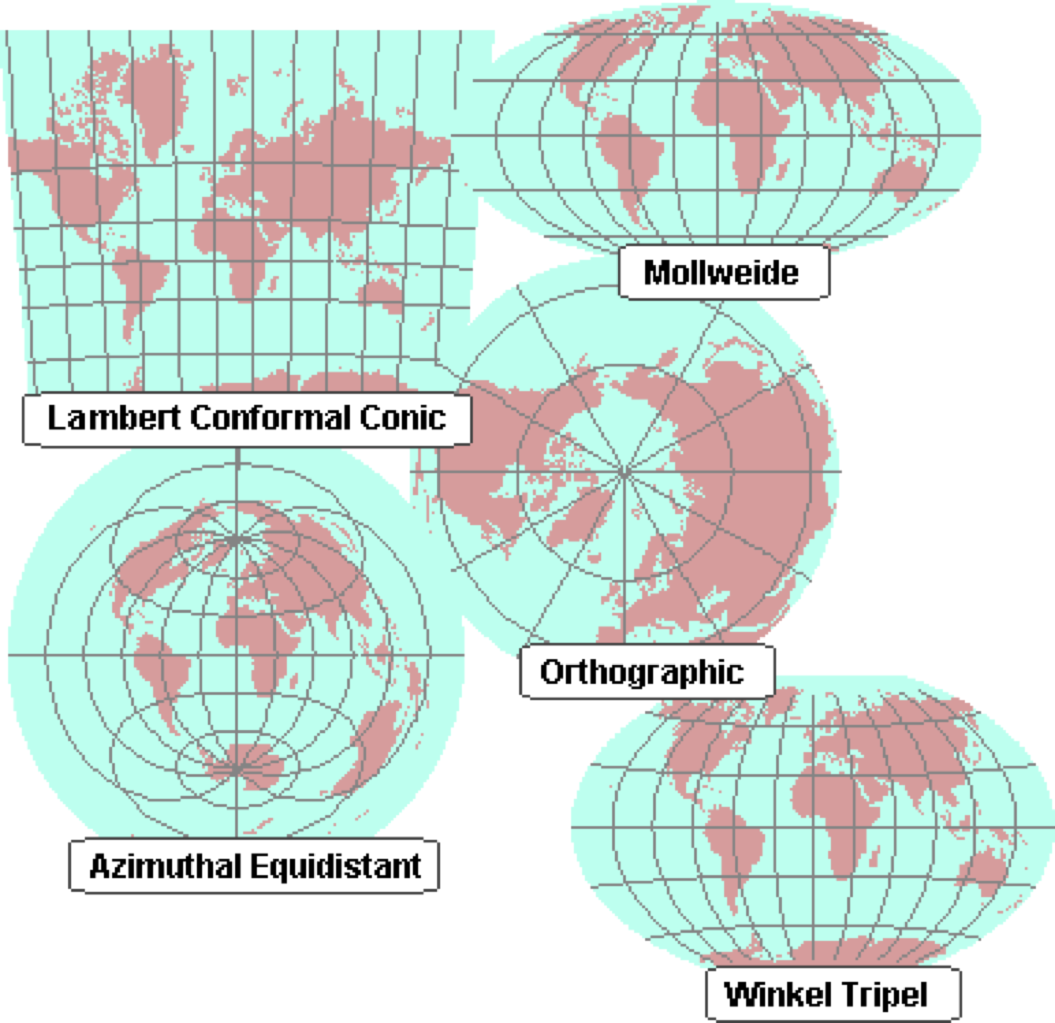
Projections that Preserve Shape
Conformal projection: all local angles measured from a point are correct and all local shapes are true.
Use conformal projection when the map’s main purpose involves measuring angles, showing accurate local directions, or representing the shapes of features or contour lines. This category includes:
- Topographic maps and cadastral (land parcel) maps
- Navigation charts
- Civil engineering maps
- Military maps
- Weather maps
Projections that Preserve Area
Equal-area projection: the size of any area on the map is in true proportion to its size on the earth. You should use equal-area projections to show:
- The density of an attribute with dots (for example, population density)
- The spatial extent of a categorical attribute (for example, land use maps)
- Quantitative attributes by area (for example, gross domestic product by country)
How does this impact your spatial analysis?
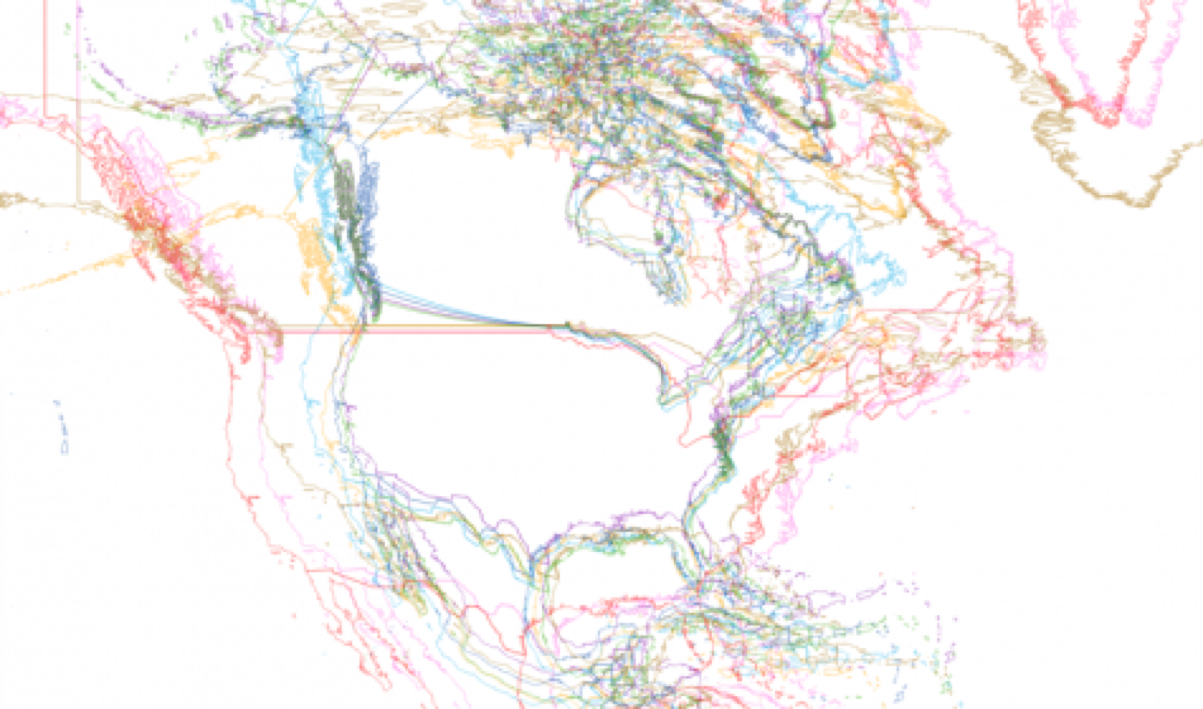
Unless explicitly calculating geometric attributes on a curved surface, the projection used will affect the result of any such calculations. For a “planar” calculation of the area of the USA, for example, different projections give different results.
Summary
The open source stack has two essential libraries at the bottom: GDAL of reading, writing and translating raster and vector data, and GEOS for geometric calculations on vector data.
We will move up the stack to software interacting with these libraries in the next lesson, but the command line utilities offered by GDAL are available for batch processing of spatial data using a shell script.
Projections distort the world - be aware of the spatial reference system your spatial data employ. If possible, find spatial data in an appropriate PCS for your analysis or convert unprojected data with a known GCS to an appropriate PCS.
If you need to catch-up before a section of code will work, just squish it's 🍅 to copy code above it into your clipboard. Then paste into your interpreter's console, run, and you'll be ready to start in on that section. Code copied by both 🍅 and 📋 will also appear below, where you can edit first, and then copy, paste, and run again.
# Nothing here yet!