
May 13, 2020 by Kelly Hondula
Every 10 years, the U.S. Census Bureau conducts a nationwide survey to count the number of people in the nation, which is known as The Decennial Census. Although seemingly a straightforward concept, using these data to appropriately quantify patterns or trends1 for any given location within the country may require getting acquainted with some nuanced jargon. This post is to introduce some concepts to help you get started.

As an authoratative resource on data about people and the economy in the U.S., the Census can be very useful for helping to synthesize data for socio-environmnetal problems. Countless spatially-explicit social datasets provide information at either point locations or at the level of counties, cities, tracts, and other units defined by the Census. Unique codes2 and accompanying spatial data provided by the Census provide a reference for combining datasets either with each other, with census data provided at that scale (e.g. from the American Community Survey), or with spatially-explicit environmental data.
The diagram below depicts relationships between different spatial units used in Census data sets:
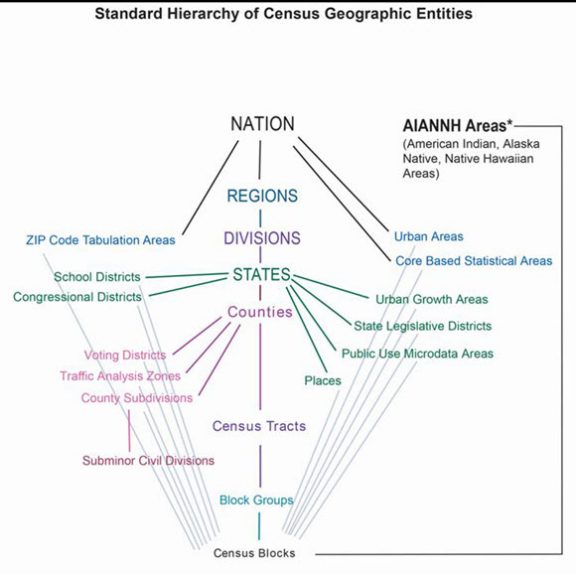
Although there is a strictly nested hierarchy between blocks, tracts, counties, etc., there are also almost twice as many(!) other named spatial scales either defined by or recognized by the Census that don’t fall neatly into that structure. Cities, for example, can span state boundaries, and Places that fall under the jurisdiction of a governing body may contain portions of one or more counties.
Spatial data defining these regions are available on the Census website along with a guide on the various products available through the Topologically Integrated Geographic Encoding and Referencing division (a.k.a TIGER shapefiles).
You can programmatically download these data from the Census FTP site, for example to download and unzip the files for 2019 Core-based statistical areas (i.e. cities):
wget -r -np zip ftp://ftp2.census.gov/geo/tiger/TIGER2019/CBSA/
Keep in mind that the number, names, and spatial extent of these areas change over time. For detailed information on individual changes, check out Geographic Boundary Change Notes. It may also be important to recognize whether scales are defined statistically or based on legal boundaries, e.g. “incorporated places” versus “census designated places”3.
These spatial data are also available as a Web Mapping Service, which means they can be added to custom maps e.g. Leaflet maps in R with the following code:
library(leaflet)

tiger_wms_url <- "https://tigerweb.geo.census.gov/arcgis/services/TIGERweb/tigerWMS_Current/MapServer/WMSServer"

leaflet() %>%
  addTiles() %>%
  setView(lng = -76.5, lat = 38.97, zoom = 8) %>%
  addWMSTiles(
    baseUrl = tiger_wms_url,
    layers = c("Metropolitan Statistical Areas",
               "Metropolitan Statistical Areas Labels"),
    options = WMSTileOptions(format = "image/png", transparent = TRUE))
The addWMSTiles() function must include the url specifying the location of the map server as well as which layers should be shown, eg. from the list here.
Although the official population count occurs only every 10 years, the census calculates estimates of populations for the in-between years. These intercensal datasets are provided through the Population and Housing Unit Estimates program, and are listed as separate data tables by decade. Note that some data for some levels are only available starting after 2010. In addition to population totals, these datasets also include information about the components of change such as number of births and deaths, net domestic and international migration.
| Level | Description | years |
|---|---|---|
| 040 | States | 2000–2010, 2010–2019 |
| 050 | Counties | 2000–2010, 2010–2019 |
| 061 | Minor civil division | 2000–2010, 2010–2019 |
| 071 | Minor civil division place part | 2000-2010, 2010–2019 |
| 157 | County place part | 2000–2010, 2010–2019 |
| 162 | Incorporated place | 2000–2010, 2010–2019 |
| 170 | Consolidated city | 2010–2019 |
| 172 | Consolidated city—place within consolidated city | 2010–2019 |
| 310 | Metropolitan/Micropolitan Statistical Area | 2000, 2010–2019 |
| 314 | Metropolitan Division | 2010–2019 |
| 330 | Combined statistical area | 2010–2019 |
So, if you want to know how the population is changing where you live, the answer might depend on which spatial scale you use. For example, SESYNC falls within all 3 of: Annapolis city (an incorporated place), Anne Arundel county, and the Baltimore-Columbia-Towson metropolitan area. The population estimates for these 3 levels of aggregation are different orders of magnitude, and whereas they all show increasing trends, Annapolis seems to have leveled off in the past few years.
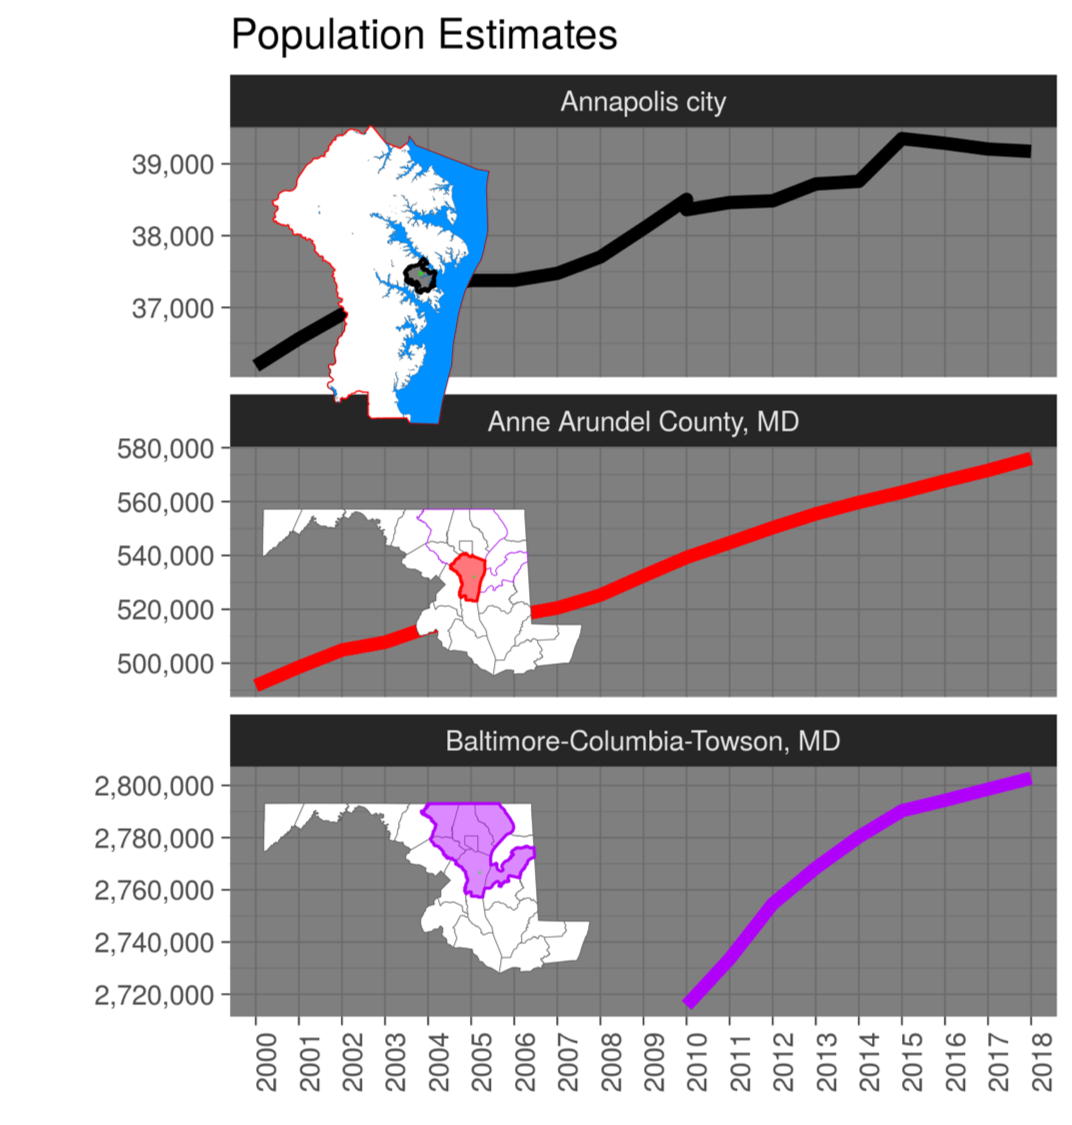
See this notebook to get the data and code for the above plot.
Data from other Census programs, such as the ACS, also publish data at multiple spatial scales (detailed here). ACS data from 2009 onwards (as well as population estimates from either 1990, 2000, 2010, or 2010 onward) are conveniently accessible through Kyle Walker’s R package tidycensus.
e.g. considering effects of the modifiable areal unit problem ↩
Besides geographic identifiers, the Census Bureau also uses or defines codes for classifying businesses, products, functional status of geographic entities, and more as described here. ↩
A primer on understanding “Place” in Census Bureau Data Products ↩